Google Analytics 1/2 – Review
Table of Contents
Introduction getting to know Google Analytics Basics
Why google analytics? In short, the main reason why you use GA is to track data and user behavior in order to identify where there is potential for optimization. GA is a very powerful tool, with many setting options, various user levels and filters with regular expressions for even finer and more specific views. All these settings are made in order, as already mentioned, to have an good overview of user- and behavior data, with the aim of achieving low friction losses and high conversion rates. Complete funnel structures from “Aware”, “Engage” to the “Complete” phase can also be measured. In visual diagrams you see the complete funnel with various metrics (numbers) such as CTR (Click Through Rate) or BR (Bounce Rate) displayed. Once Google Analytics has been properly set up and made “multi-tenant” so to speak, it is easy to evaluate all data and traffic sensibly and strategically.
Overview:
- Google Marketing Platform
- Analytics
- Optimize
- Surveys
- Data Studio
- Tag Manager
- …
Google Analytics (GA) for tracking (store/collects/reports) all sorts of interaction & behaviors

- Dimensions vs. Metrics
- Dimension = page categories
- Metrics = numbers
GA Concept structure:

the concept structure should visualize that related websites goes to the same property and different projects (websites) should better be isolated in different properties or even accounts.
Key Take aways:
- Important question to ask: WHO ARE MY USERS
- Learning to know where my audience is coming from (location, device, browser…) and what they are interested in, which gender, age, behavior and so on is very essential in GA. With that knowledge further steps can be planed
- Real time traffic = for testing
- Audience = who are my users
- Aquisition = where are my users
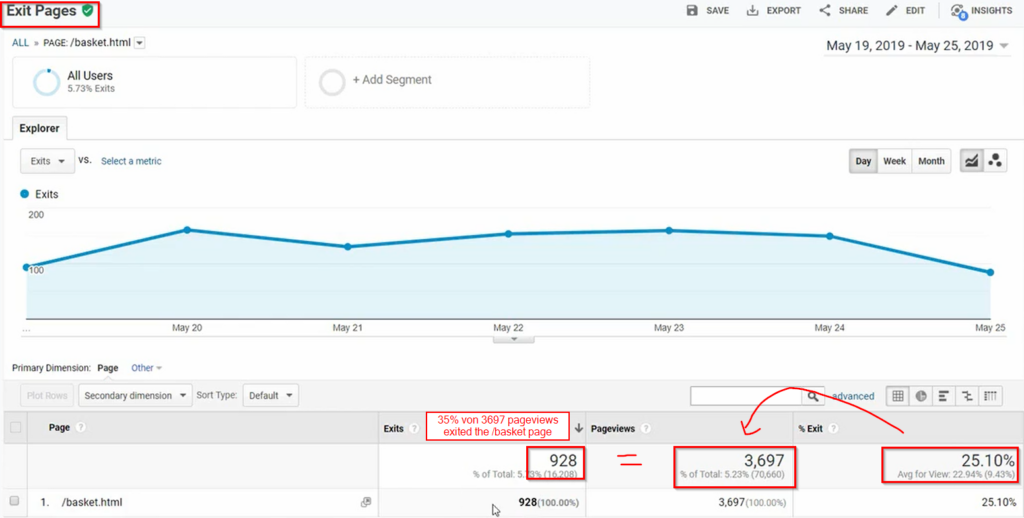
Bounce vs. Exit

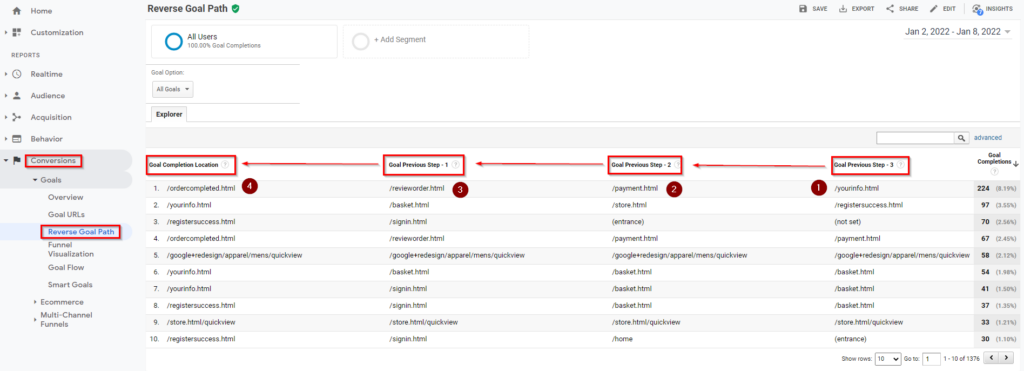
Getting to Know GA: Conversions Reports
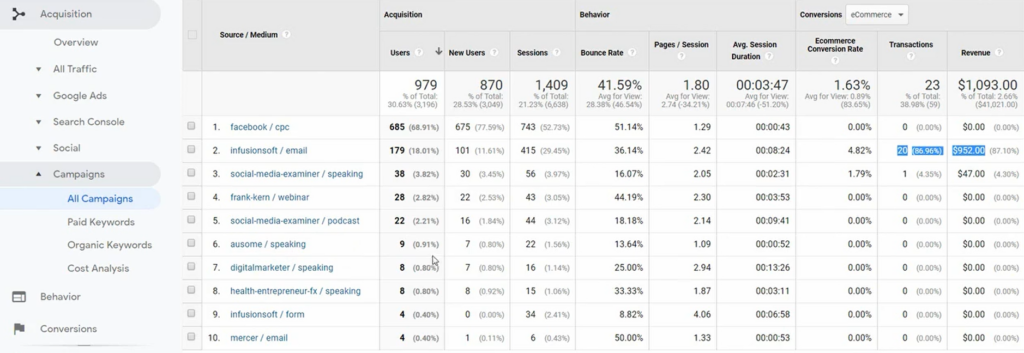
Understanding Traffic: Types of Traffic
- Acquisition > All Traffic > Source/Medium
- Table search is always for first dimension filter
- For secondary dimension the advanced filter is necessary

Understanding Traffic: Customizing Traffic Sources
- Urchin Tracking Module (UTM) parameters are five variants of URL parameters used by marketers to track the effectiveness of online marketing campaigns across traffic sources and publishing media
- Example for good campaign structure: (win)
- Brands of traffic (source)
- Types of traffic (medium)
- Purpose of traffic (campaign)
Example:
Ressources:
- https://web.utm.io/
- MeasurementMarketing.io UTM Builder – Traffic Tracker: https://docs.google.com/spreadsheets/d/1hrgabpr6Ye9Z13_MZpzoKRgH5Ehd3lXwNQck5Nvg_Gc/edit#gid=2085920761
- Blog for custom filters: https://holini.com/google-analytics-filters/
Understanding Results: Destination Goals
- A.C.E goals = Aware, Complete, Engage
- Goal concept: Admin > Testing View-CXL > Goals

Goal Funnel setup:

- Regex expressions:
- Example Funnel structure: Conversion > Goals > Funnel Visualization

Understanding Results: Duration Goals
- Avg. Time on page: dont take it like the real time it´s just a notice in comparision with other pages e.g. landingpage vs. Member page (it´s mostly common that users will stay longer at the lp as on the member page because of the quaility of information they got from the LP.
- Short explanation of how GA track the timestamp:
- GA doesnt track the time on a homepage, because there is no other parameter (timestamp) to compare with (like ist shown in the session 2. here you can see 2 pageviews with 2 timestamps (technically) in real GA can only measure 1 timestamp from homepage to “win course” in this case 33 seconds
- GA doesnt track the time on a homepage, because there is no other parameter (timestamp) to compare with (like ist shown in the session 2. here you can see 2 pageviews with 2 timestamps (technically) in real GA can only measure 1 timestamp from homepage to “win course” in this case 33 seconds

Understanding Results: Event Goals

Remember:
- Audience = WHO are my users
- Acquisition = WHERE they come from
- Behavior = WHAT actions they taking
- Events are great for tracking engagement from the users e.g. how far they scroll down the site, how long they watched a video and so on.. This needs to be set up manually and in combination with Google Tag Manager
Understanding Results: Ecommerce
Find
Grab
Send
- Without setting up the funnel structure in GA, it will show no details about your ecommerce shop
- So ist recommended to setup checkout steps for a detailed view on “checkout behavor analysis” in your GA
- Start with the standard ecommerce reporting before you go on with enhanced view
- Also start with “product performance” and set up your products
Analyzing Reports – The Basics
Question
Information
Action
- Important: Finding thje story behind the metrics
- Find the patterns behind the numbers
Ressources:
- Tips to improve yur GA Analysis: https://online-metrics.com/21-tips-to-more-effectively-analyze-google-analytics-data/
- A good blog how to ask the right questions regarding marketing idea: https://www.orbitmedia.com/blog/google-analytics-reporting-analysis/
- Crucial questions to aks: https://conversionxl.com/blog/digital-analytics-questions/
Personal feedback about the Google Analytics course:
- I really enjoyed the course from Chris Mercer about Google Analytics. His ‘hands on’ approach with google demo account and showing practical use cases combined with own illustrations in lucid charts for understanding the basic concept makes it pritty nice to follow him. The motivation stays high! Really appreciate and enjoyed his course.
- Also I love how Chris Mercer structure his course and going through the details like showing the roadmap, next steps, lesson recap and in the videos on the timeline different chapters.. excellent!
